Predicting Pre-meal Glucose using Sparse Optimization and Time-Series Features
PersonalRelated Papers
Project Repository
Paper Preview
Predicting Pre-meal Glucose using Sparse Optimization and Time-Series Features
Introduction
This project studies how to predict a patient's next pre-meal glucose level while keeping the model as sparse and interpretable as possible. The central tradeoff is accuracy versus parsimony: the goal is not only to reduce prediction error, but also to identify the fewest meaningful predictors behind glucose behavior.
The work compares two optimization-focused implementations built on the same diabetes dataset. Both approaches use prior insulin, meal, exercise, and glucose history, but they differ in feature engineering depth and in how they formulate and solve the regression problem.
Pre-meal Glucose Prediction Overview
Problem Framing
The prediction target is the next pre-meal glucose reading for a patient. The model tries to estimate that value from earlier activity signals such as:
- insulin dosage
- meal events
- exercise events
- previous glucose measurements
- patient-specific timing context
The broader motivation is medical decision support. A sufficiently accurate and interpretable model could help clinicians and patients understand expected glucose ranges, identify influential behaviors, and distinguish which historical patterns are most useful for prediction.
Optimization Model
The core linear prediction model is:
y_i = beta_0 + x_i^T beta
where:
y_iis the target glucose value for observationix_iis the feature vectorbetais the coefficient vector
Both implementations use mean squared error as the base loss and then compare regularized variants that encourage sparsity and constrain coefficient growth.
Ridge:       min ||y - X beta||_2^2 + lambda ||beta||_2^2
LASSO:       min ||y - X beta||_2^2 + lambda ||beta||_1
Elastic Net: min ||y - X beta||_2^2 + lambda_1 ||beta||_1 + lambda_2 ||beta||_2^2
For Ridge, the slides also present the closed-form solution:
beta_hat = (X^T X + lambda I)^(-1) X^T y
LASSO and Elastic Net do not have a closed-form solution because of the L1 term, so they are solved numerically instead.
Dataset
The project uses the UCI Diabetes dataset, containing outpatient diabetes records from 70 patients collected across weeks to months of care. Each record includes:
- patient identifier
- date
- time
- event code
- measured value
Several domain-specific codes were especially important in the modeling:
33: Regular insulin dose34: NPH insulin dose35: UltraLente insulin dose48,57: Unspecified glucose measurement58,60,62,64: Pre-meal glucose measurements used as the target family
Data Preparation Pipeline
The slide deck outlines a full preprocessing flow before optimization:
- Extract patient files from the compressed source data.
- Combine the patient-level records into one dataset.
- Transform the data from long format into wide format so event codes become columns.
- Define target rows using the pre-meal glucose codes.
- Build historical features using only events that happened before the target measurement.
- Clean malformed dates, irregular times, and nonnumeric values.
- Split by time so earlier observations are used for training and later observations for testing.
This time-aware split was important for preventing leakage from future information into the model.
Implementation 1
The first implementation uses deeper feature engineering and relies on scikit-learn model families such as RidgeCV, LassoCV, and ElasticNetCV, along with comparison baselines.
Key preparation choices:
- dates were normalized to
Days since start - time was converted to
MinuteOfDay - missing values were imputed
- features were standardized with Z-score scaling
- 5-fold cross validation was used during tuning
The engineered feature set summarized historical activity across multiple lookback windows:
typical_meal_6h: Number of prior66meal events over the last 6 hoursmore_meal_6h: Number of prior67meal events over the last 6 hoursless_meal_6h: Number of prior68meal events over the last 6 hoursregular_insulin_8h: Sum of code33over the last 8 hoursnph_insulin_24h: Sum of code34over the last 24 hoursultralente_insulin_24h: Sum of code35over the last 24 hourstypical_exercise_6h: Number of prior69exercise events over the last 6 hoursmore_exercise_6h: Number of prior70exercise events over the last 6 hoursless_exercise_6h: Number of prior71exercise events over the last 6 hoursprev_glucose: Most recent pre or post glucose measurementhours_since_prev_glucose: Hours elapsed since the previous glucose readinghypo_symptoms_24h: Number of prior65events over the last 24 hoursspecial_event_24h: Number of prior72events over the last 24 hours
The implementation also compared two versions of the model:
- a general model without patient identity
- a patient-aware model with one-hot encoded patient ID features
Candidate models included:
- mean predictor
- previous glucose predictor
- Ridge regression
- LASSO regression
- Elastic Net regression
Implementation 2
The second implementation takes a more direct optimization route and focuses on custom objective functions and numerical solvers. It frames the problem as least squares with optional L1 and L2 penalties, then solves the resulting models with:
- gradient descent for unconstrained and L2-regularized least squares
- proximal gradient descent for L1 regularization
- Elastic Net as a combined L1 and L2 objective
This version emphasizes the optimization properties more explicitly:
- the objective is convex
- the feasible region is effectively constrained by the penalty terms
- the objective is bounded below by zero
- a global minimum exists under the regularized setup
The slides note that all tested methods converged within the chosen iteration budget of 1000.
Model Behavior and Results
The two implementations emphasize slightly different strengths.
Implementation 1 showed that pre-meal glucose prediction can be framed as a sparse regression problem where a relatively small predictor set can still retain useful accuracy. One of its key findings was that including patient identity improves fit, but also makes the model less general.
Notable findings from the slides:
- the general Elastic Net model selected 7 predictors
- the patient-ID Elastic Net version selected 43 predictors
- incorporating patient identity improved performance by about 6 percent in the reported comparison
Implementation 2 reported its strongest overall test performance with the L2-regularized model:
L2 regularization: lowest reported overall test MAPE at15.25%LASSO: more parsimonious because coefficients can shrink fully to zeroElastic Net: middle ground between sparsity and coefficient stabilityUnconstrained least squares: least sparse baseline
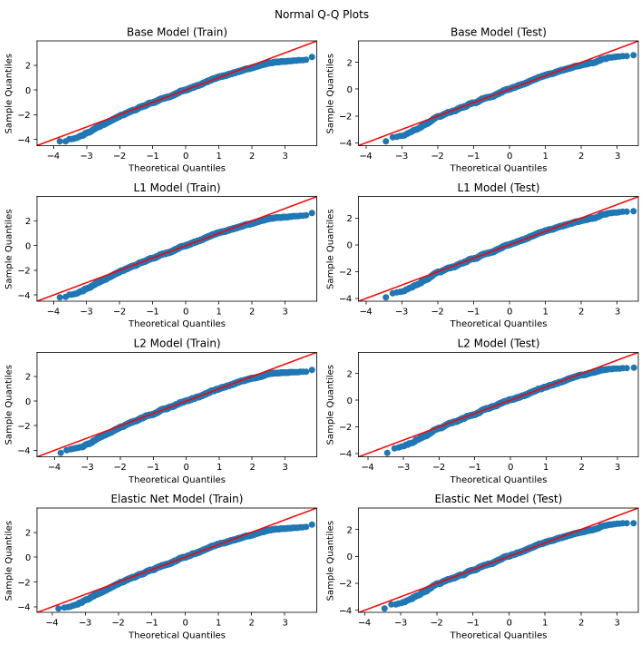
The residual and Q-Q plot discussion in the slides suggests the linear fit was generally reasonable, with only mild evidence of possible nonlinearity.
Key Insights
Several higher-level conclusions came out of the compare-and-contrast approach:
- pre-meal glucose is not random and does contain predictive structure from prior activity
- sparse models can remain competitive while being easier to interpret
- patient-specific modeling may be more useful for ongoing monitoring of known patients
- simpler models may be more appropriate when patient history is limited
The presentation also highlights an important modeling reality: a one-size-fits-all approach is weak for this problem because individuals differ in metabolism, physiology, insulin response, and daily habits.
Limitations
The slide deck calls out a few major limitations:
- the dataset is small and medically constrained
- the source data is irregular rather than a clean evenly spaced time series
- richer physiological and contextual patient features were unavailable
- simpler models may trade lower variance for increased bias
- purely linear methods may miss nonlinear glucose dynamics
Future Work
If more time and richer data were available, the project would extend the feature space with:
- meal carbohydrate amount
- patient physiology such as age, weight, and metabolism
- medical background
- exercise intensity
- sleep and stress information
- meal context
- body composition
The team also proposed comparing the sparse regression framework against more explicit time-series models such as autoregressive methods or LSTM networks, especially because real glucose behavior may include seasonality and cyclic structure.
Takeaways
This project is a strong example of using optimization as a modeling lens rather than treating prediction as a black box. By comparing two different sparse-regression workflows, it shows how interpretability, sparsity, and predictive accuracy can be balanced in a healthcare setting where explainability matters.
Project Gallery